Synopsis: D2C brands sell straight to shoppers through their own websites, apps and stores instead of relying only on distributors. Estimates of India’s D2C market range from about US$60 billion by 2030 to US$310 billion by 2031, because each report measures something different. Apparel, personal care and food lead.
Last updated on 21 November 2026. EQMint updates this guide regularly.
D2C, short for direct-to-consumer, is now one of the most used terms in Indian startup and consumer business. Founders use it to describe their brands, investors use it to describe a sector, and large FMCG companies have spent crores buying D2C labels. Yet the size of the market depends heavily on which report you read. This guide explains what D2C means, how the business model works, what the main published estimates say about India’s market up to 2030 and beyond, and which product categories lead. Every number below is attributed to the firm that produced it, with the date it was published.
What D2C means
A direct-to-consumer brand makes or sources its own products and sells them to the end customer without a chain of distributors, wholesalers and retailers in between. The typical sales channels are the brand’s own website, a mobile app, social media storefronts, and increasingly its own physical stores. Many D2C brands also list on marketplaces such as Amazon and Flipkart and on quick-commerce apps, but they control the brand, pricing, product design and customer communication themselves.
The traditional consumer-goods model works differently. A company sells to a super-stockist, who sells to distributors, who supply lakhs of kirana stores. Each layer takes a margin, and the company rarely knows who the final buyer is. In the D2C model the brand keeps more of the margin and owns customer data such as purchase history, repeat rates and reviews. In return it pays for marketing, warehousing, delivery, returns and payment collection, costs that a distributor network would otherwise absorb.
D2C is not limited to startups. Older companies run D2C websites, and FMCG groups have bought digital-first brands to reach younger online buyers. EQMint’s D2C Pulse section tracks these brands, their funding and their results.
EQMint analysis: why the estimates differ by up to five times
A founder or investor searching for “India D2C market size” will find figures from US$30 billion to more than US$300 billion. EQMint compared the main published projections and worked out the growth rates each one implies. The gap comes from definitions, not from errors: some reports count only sales on a brand’s own channels, some count the gross merchandise value (GMV) of digital-first brands across all channels, and some include marketplace sales.
| Report (published) | Starting point | Projection | Growth rate |
|---|---|---|---|
| Shiprocket, CII and Praxis (June 2022) | US$12 billion (2022) | US$60 billion by FY27 | About 40% stated; 38% a year by EQMint’s calculation |
| Redseer (October 2023) | Not stated | US$30-35 billion GMV by 2027 | Around 40% (2022-27) |
| KPMG (October 2024) | About US$12 billion (2022) | Over US$60 billion by 2027 | 40% stated |
| Unicommerce, via IBEF (April 2026) | FY26 orders up 33%, GMV up 32% | ₹5.58 lakh crore (US$60 billion) by 2030 | Not stated |
| Inc42 ecommerce report (May 2026) | US$65 billion D2C GMV (2026) | US$310 billion by 2031 | About 37% stated; 36.7% by EQMint’s calculation |
Source: Business Standard (Shiprocket-CII-Praxis, Redseer), The Week (KPMG), IBEF (Unicommerce), Inc42; growth rates computed by EQMint from the stated start and end values, as of 21 November 2026.
Three points stand out from the comparison:
- Every report expects growth of close to 40% a year. The 2022 Shiprocket study’s start and end figures work out to 38% a year, and Inc42’s 2026 figures work out to 36.7%. Different firms, different years, similar pace.
- “US$60 billion” appears twice with different deadlines. Shiprocket and KPMG put it at FY27 or 2027; the Unicommerce figure cited by IBEF puts it at 2030. These are different measures of the market, so they should not be read as a downgrade.
- Inc42 has the widest definition. Its report puts D2C GMV at US$65 billion of a US$165 billion ecommerce market in 2026, which EQMint calculates as 39%. By 2031, US$310 billion of a projected US$450 billion would be 69%, which matches Inc42’s statement that D2C would make up more than two-thirds of ecommerce GMV.
For founders, the practical point is to quote a market figure together with its source, year and definition, especially in a pitch deck. An investor who has read a different report may otherwise question the number.
Top D2C categories in India
There is no single official count of D2C sales by category. The two clearest published measures are revenue share among tracked brands and share of venture funding.
| Category | Brands tracked | Share of FY23 revenue |
|---|---|---|
| Apparel | 25 | 27.72% |
| Personal care | 38 | 20% |
| Food and beverages | 48 | 18% |
| Health and wellness | 21 | 6.7% |
| Pet care | 7 | 4.37% |
| All other categories | 38 | 23.21% (EQMint calculation) |
Source: TheKredible data on 177 D2C brands, reported by Entrackr on 23 August 2024; FY23 is the latest year in that dataset, as of 21 November 2026.
The 177 brands in this dataset earned about ₹34,360 crore in FY23, which EQMint calculates as an average of roughly ₹194 crore per brand. Apparel, personal care and food together made up about 66% of their revenue. Food and beverages had the most brands but a smaller share of revenue than apparel, which suggests many food brands are still small.
Funding tells a similar story. Inc42’s May 2026 report says food and beverages is the largest single D2C segment, accounts for roughly one-third of funded D2C startups, and has drawn nearly US$3 billion since 2015, out of more than US$10 billion raised by all D2C startups between 2015 and the first quarter of 2026. On those figures, food took roughly 30% of all D2C funding. KPMG’s 2024 report named hygiene and personal care, beauty and skin care, and healthy snacks and beverages as the top categories.
Newer categories are growing fast from smaller bases. In logistics firm ClickPost’s FY2026 data from 63 brands on its network, sleep and comfort orders grew 69%, wellness 46% and skincare and beauty 39%. That is a sample from one network, not the whole market. Recent EQMint coverage of Style Union’s ₹485 crore round and the H.I.M men’s personal care launch shows fashion and grooming still drawing money and new entrants.
What is driving D2C growth
The reports point to the same drivers. Cheap mobile data and UPI payments have brought tens of millions of new online shoppers. Unicommerce’s FY26 data, as reported by IBEF, shows tier 2 and tier 3 cities were expected to bring nearly 66% of new D2C orders, so growth is no longer limited to metros. Shiprocket’s 2022 study expected more than 500 million online shoppers by FY30. Redseer projected D2C shipments to rise from about 0.5 billion in 2022 to 3 billion by 2027, which is why logistics firms are building services for D2C sellers. Quick commerce and offline stores are now added channels for many brands, which blurs the line between D2C and traditional retail.
Frequently asked questions
What is the difference between D2C and ecommerce?
Ecommerce is any sale made online, including a marketplace selling thousands of brands. D2C describes a brand selling its own products directly to buyers. A D2C brand may sell online, offline or both.
How big will India’s D2C market be by 2030?
Estimates differ by definition. The Unicommerce figure cited by IBEF is ₹5.58 lakh crore (US$60 billion) by 2030. Inc42’s wider GMV measure projects US$310 billion by 2031. Always check what a report counts.
Which D2C category is the largest in India?
By FY23 revenue among 177 brands tracked by TheKredible, apparel led with 27.72%. By funding and number of funded startups, Inc42 says food and beverages is the largest segment.
Do D2C brands sell on Amazon and Flipkart?
Many do. Most Indian D2C brands use their own website along with marketplaces, quick-commerce apps and, as they grow, their own stores.
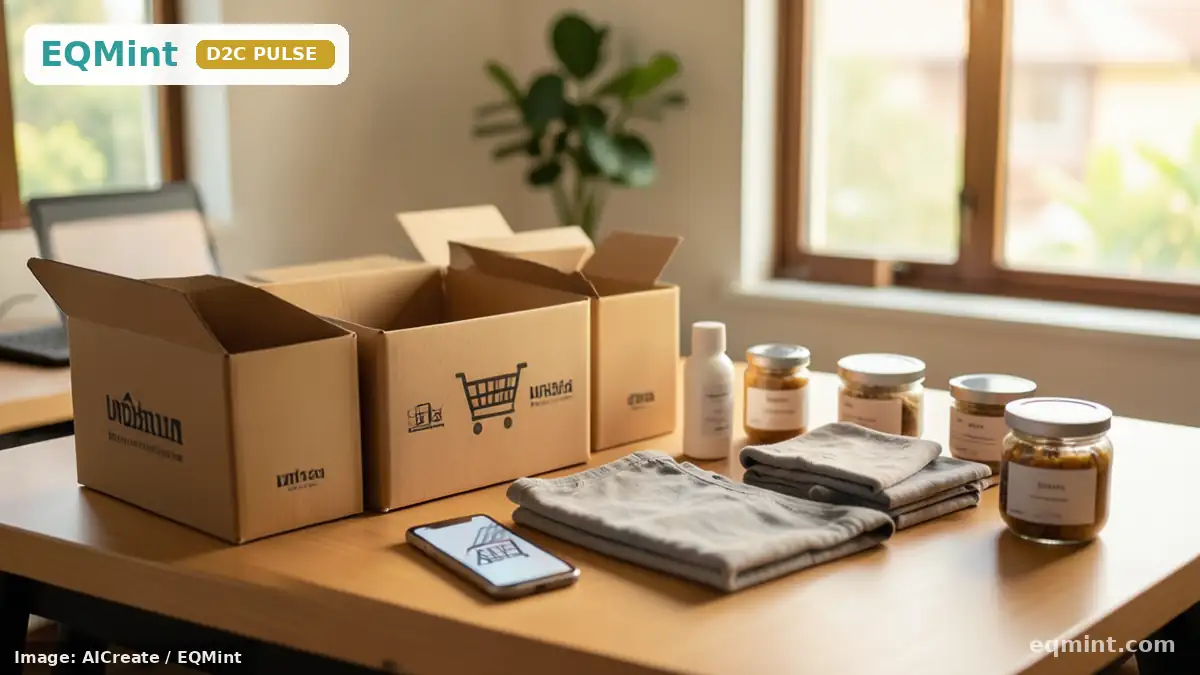
Image credit: AICreate / EQMint (representational).
Sources
- Source: IBEF, India’s D2C growth powered by tier 2, 3 cities (Unicommerce report), 21 April 2026
- Source: Inc42, D2C 3.0: The New Rules of India’s D2C Economy, 14 May 2026
- Source: Business Standard, D2C market likely to reach GMV of $35 billion by 2027 (Redseer), 6 October 2023
- Source: Business Standard, Indian D2C sales could reach $60 bn by FY27 (Shiprocket-CII-Praxis), 27 June 2022
- Source: The Week, Indian D2C market expected to surpass US$60 billion by 2027 (KPMG), 21 October 2024
- Source: Entrackr, The D2C revolution (TheKredible data), 23 August 2024
- Source: ClickPost, India E-Commerce Trends Report FY2026
Disclaimer: This article is for information purposes only and is not investment advice.
For more such information, visit EQMint
Join our WhatsApp channel for timely updates: Whatsapp